|
Merging Site Observations with GIS Data |
|
|---|---|
| Screenshot |
|
| This workflow documents the process of creating printable maps for recording observations in the field, incorporating this recorded data into existing GIS data found in Openstreetmaps. | |
| Uses Tool(s) | Grasshopper |

Steps
Step 1 - Install JOSM and Required Plugins
JOSM is a GIS editor, written in Java, made to author and upload data to openstreetmap. If you're using Windows, you can download a windows installer (verson 7480 at the time of writing) that will make setup quite easy. JOSM requires JAVA , If you don't already have Java installed on your computer, when you launch the program you will be prompted to download and install a JRE (Java Runtime Environment) and directed to the proper location to do so.

- Download and install JOSM .
- Run JOSM, selecting the option to "update all plugins" on launch.
- Select Edit->Preferences (or press f12).
- Select the "Plugins" tab by clicking on the stupid picture of a plug on the left side of the window.
- In the search field, type "fieldpapers" and then check the checkbox next to the plugin called "fieldpapers: Verson XXXXX". Then click "OK". The plugin will download, and you will be prompted to restart JOSM.
- After the program restarts, confirm that the Fieldpapers plugin was loaded properly by looking for "Field Papers" in the menubar.

Step 2 - Create a Printable 'Atlas'
Field Papers is an online tool built by Stamen Design to help people create a multi-page atlas of anywhere in the world. Once you print it, you can take it outside, into the field, to record notes and observations about the area you're looking at. Later, you can photograph or scan each page in the atlas, and upload back into Field Papers. These photographs are called "snapshots" on the site. When you upload a snapshot, it's connected automatically to the atlas from whence it came. You can transcribe any notes you made in the field into Field Papers (as points or areas) and share the results or download your notes for later analysis.
The following video describes this process in painstaking detail.
Search for the Relevant Location on Fieldpapers
Navigate to the Fieldpapers Search Page and search for the geographical location you would like to map.
Customize Graphic Properties

On the "Area" page, refine the graphic properties of your printed atlas by using the online interface provided by Fieldpapers. Note that:
- You may scale the printed area using the 'arrow' widget on the bottom right of the online interface.
- You may move the printed area by using the 'move' widget on the top left of the online interface.
- For large areas, you may change the number of plates that are printed using the (+) and (-) buttons.
Press the 'Next' button to continue.
Name the Atlas

On the "Info" page, follow the instructions for naming your atlas. Make sure your atlas remains public to ensure we can download it to our editing software later on.
Layout Options

On the "Layout" page, follow the instructions for laying out your printed atlas. Any of the options found here will suffice for this workflow.
Click on "Finished" to continue.
Generate the Printable Atlas
It will take some time to generate your atlas. Once this process is complete, your settings will have been saved to the Fieldpapers website, and a page will be displayed from which you may download a PDF version of your atlas (as well as GeoJSON, CSV, and Shapefile data if you'd like).
Click on the "download PDF" link and save a copy of this multi-page PDF somewhere on your computer. If you open this PDF file, you'll notice a few things that will help you in recording field observations, and in digitizing these so that they may be merged with GIS data.
- First, you'll see a graphic scale and a North arrow on the lower left of each page.
- Second, you might notice seven black circles along the border of each map. These may be used as registration marks when drawing in overlay, and will help you to register your drawings to the map underlay. These circles are also used by Fieldpapers to register your notes to GIS data .
- Finally, you'll notice a QR Code on the bottom right of each page of your atlas - this will be read when you scan your pages back into the computer in order to register your sketches.
-
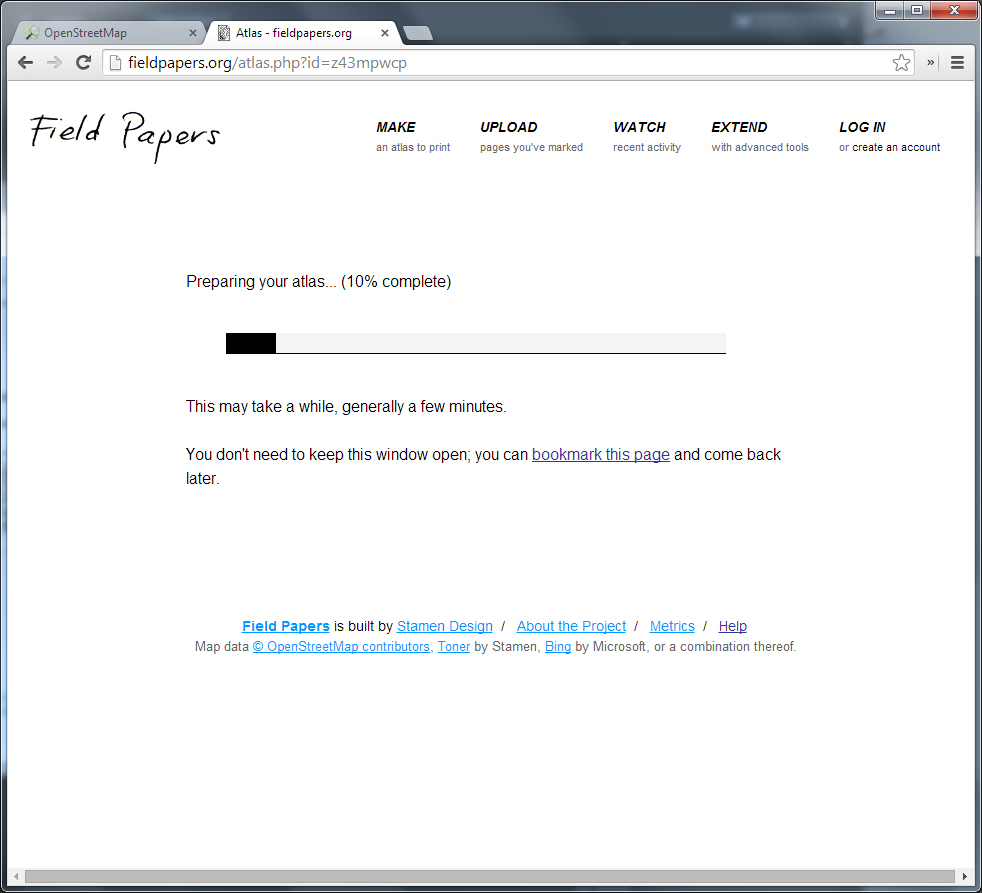
an atlas being generated
-
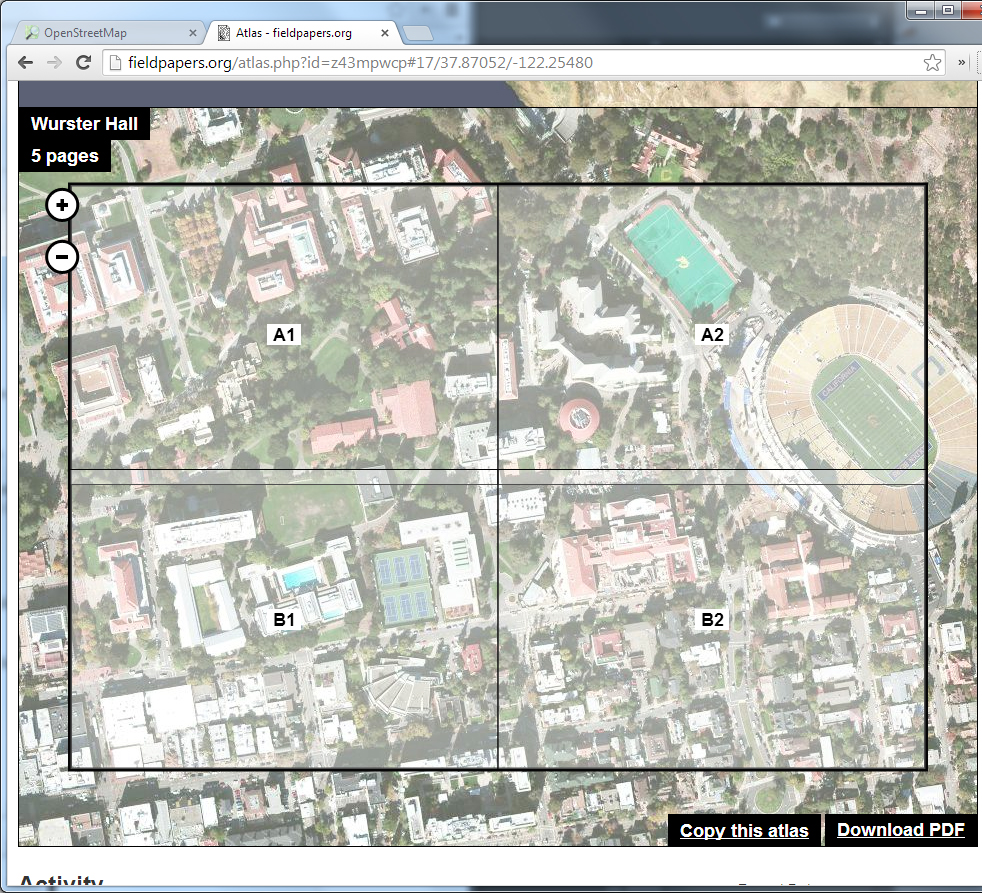
the generated atlas
-
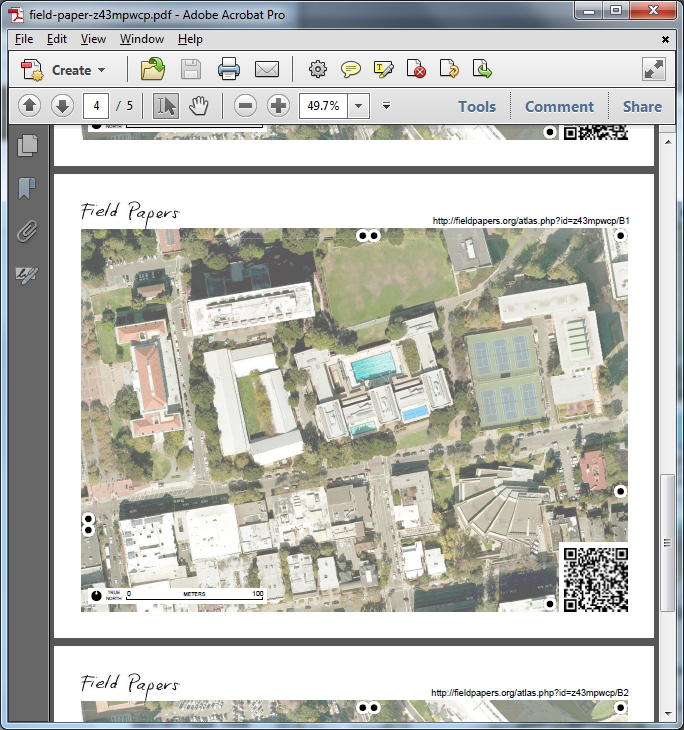
the atlas as a PDF file


Step 3 - Record Field Observations
After printing the PDF version of the atlas created with Fieldpapers, you're ready to head into the field to record your observations. You may choose to draw directly on the maps that you've printed (in which case you may skip the application of the QR Code graphic, below), but we recommend that you record observations on layers of tracing paper so that multiple sets of observations may be separated easily.
If you choose to record on tracing paper, be sure to make marks that register the map underlay onto each layer of your drawing (note the marks in blue in the image below). This will allow you to line up the QR code to produce images that may be registered with GIS data later on. These marks should not cover either the QR Code or the registration circles as these are required by the Fieldpapers website for registration.
For the purposes of this workflow, we'll be using 'fake' hand-drawn notes that were actually drawn in Illustrator.

Step 4 - Digitize Hand-Drawn Notes
Working layer-by-layer, take digital images (using a high-quality digital camera if you have one, or just the camera on your phone if you don't) of your field notes. Be sure that the registration marks you made by hand (represented above as blue crosses) line up on the map underlay.
It is very important that the QR code square and each of the seven registration circles are clearly visible in the resulting image. This may be achieved by cutting away the tracing paper in this area, or by composting a scanned image of your notes with the original PDF downloaded from Fieldpapers (as was done for the image below) using Photoshop or similar image editing software.
Save these "markup images" using appropriate file names in a convenient location on your computer.

Step 5 - Upload Markups to Fieldpapers
The unique aspect of the Fieldpapers website is its ability to register marked-up maps with other types of GIS data, and to save this information in a accessible file-format.
Complete the following steps for each of the layers of field observation you've produced:

Browse to the upload page on Field Papers and upload the appropriate markup image. This upload may take some time, after which the image will be processed.
On the next page, wait for the image to be processed. If you see a message that says "giving up", go back one page and try again after checking that the QR Code is clearly visible, and that your image is high enough resolution and is right-side-up.
When successful, you'll see the fieldpapers editing page . If your field notes are very simple, and contain only a few nodes and areas, you can add rudimentary information on this page, or by clicking the "Edit in iD" or "Edit in Potlatch" links. For more complex notes, continue to follow the instructions below.
Common Problems in Image Processing
- The image is too low resolution
- The image is not in the proper format (use JPG, PNG or TIFF)
- The registration circles are not visible
- The QR Code is too close to the edge of the image
- The image is upside down
Note that the geotagged image you uploaded is publicly accessible, so don't include any information here that you don't want everyone to see!
Copy the entire URL of the fieldpapers editing page (it should contain "snapshop.php" to the clipboard and move on to the next step.
Step 6 - Download and Merge Data
Using the geolocated image on Field Papers and the data freely available on Openstreetmap, we are now ready to create a merged dataset.
- Launch JOSM and from the top menubar, select FieldPapers->Scanned Map...
- Paste the URL from the previous step into the dialog box. The image should now download and be displayed in the application window.

- Download map data from the OSM server by selecting File->Download from OSM... or clicking the button seen below. A dialog will launch which allows you to select an area - do not pan the map or change the selected area , simply click "Download"

- You should now see both your scanned map and a whole bunch of data from OSM displayed in the JOSM interface, and are now ready to record your field observations in OSM format.

Step 7 - Record Your Field Observations in OSM Format
JOSM is an open source program made specifically for authoring and contributing data to the Openstreetmap project. It is not commercial software, and does not offer the slickest user interface (to say the least). It is, however, perfect for the narrow purposes of this workflow, and worth struggling through in this regard.
OSM data is structured as follows:
- Nodes
- Point locations recorded as Lat/Long coordinates. Nodes can be tagged with data themselves and can be referenced by other entities that are themselves tagged.
- Ways
- Linear elements that reference nodes, may be open (as in streets or segments of streets) or closed (as in building footprints).
- Tags
- Metadata that may be attached to any other entity as key-value pairs.
- Layers
- Collections of related nodes, ways, and tags. In OSM format, layers behave more like files than like layers in Rhino, Photoshop, or Illustrator. Each layer, for example, must be saved in its own separate file.
An important note : unless your field observation data is relevant to the openstreetmap project (which is unlikely), you should NOT upload any changes you make to the OSM server. Instead, simply work from local files.
There are several things to note about the JOSM interface. The two most commonly used toolbar buttons are the geometry selection tool and the geometry creation tool, as seen in the screenshot below. The mousewheel may be used to zoom, and you may pan by clicking and holding the right mouse button. There are three panels that will be useful when tracing your observation data:
- The Layer Panel
- Displays the 'layers' of data, which correspond to the data files you have loaded into a session.
- The Tags Panel
- Displays tags for the currently selected object, and allows for the addition of new tags.
- The Selection Panel
- Displays general information about the currently selected object.

- First, start a new layer that will contain the data for your observations by typing Cntl+N or selecting File->New Layer. Select this layer (probably named 'Data Layer 2') in the Layer panel clicking in the column just to the left of the name of the layer such that a green circle with a check appears next to the layer you wish to activate. Note that only geometry on the currently active layer may be manipulated (including 'snapped' to).
- Next, using the geometry creation tool, trace each observation that you have made. Point geometry may be created with a single click, followed by the Esc key which cancels the operation, leaving just a single point behind. Linear geometry may be created by clicking several times in succession, using the Esc key to stop drawing. Closed region geometry may be created in a similar way, completing the operation by clicking again on the start node.

- After creating each piece of geometry, you will want to 'tag' it with relevant metadata. You can do this by selecting a piece of geometry, and clicking the "Add" button in the Tags Panel. A dialog will appear asking you to define a key-value pair. Standard and recently used keys and values are displayed, but you may type any sort of key and value that you wish.
- When you're done adding all your observed data, save the new layer you created by selecting File->Save or typing Cntl+S. Note that each layer is saved in its own file , so you should save each layer you wish to keep in this way with appropriate file names.