|
Creating a Program Circulation Diagram |
|
|---|---|
| Screenshot | |
| This workflow demonstrates how a simple massing can be programmed with boxes to divide and discern the location of the various circulation and programmatic elements. This workflow will start in Rhino, move to VRay and finished in Illustrator | |
| Uses Tool(s) | Rhinoceros , VRay , Illustrator CS5 |
The files used in this workflow can be found here:
Week 6_Program Diagram.zip
Step 1: Start with a Massing Model
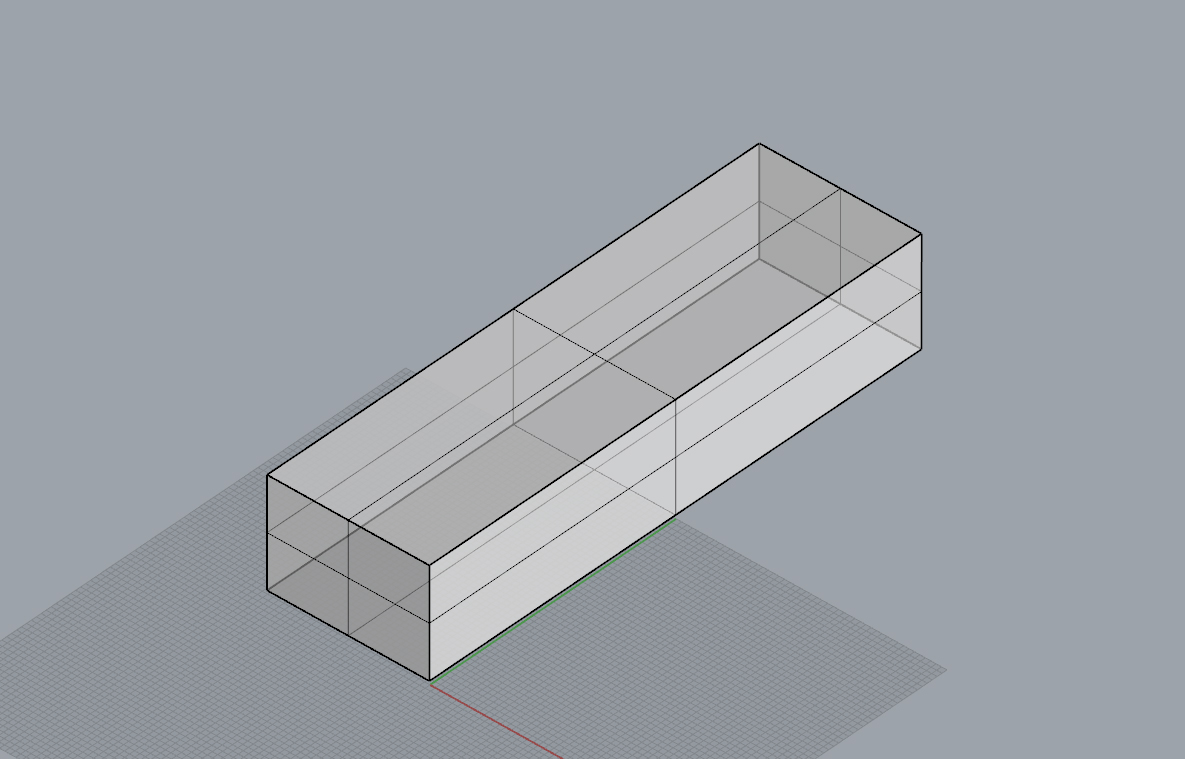
- For this workflow, we're working with a simple massing model. This often represents lot size or building code related setbacks.
Step 2: Create Axon View
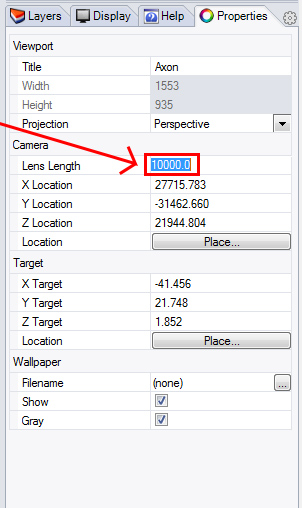
- By setting your lens length to 10,000, you essentially trick Rhino into making a parallel view. We are doing this instead of simply changing to parallel view in order to allow the axon to be rendered. The z-axis should be completely vertical at this point.
Step 3: Place Program Boxes in Massing
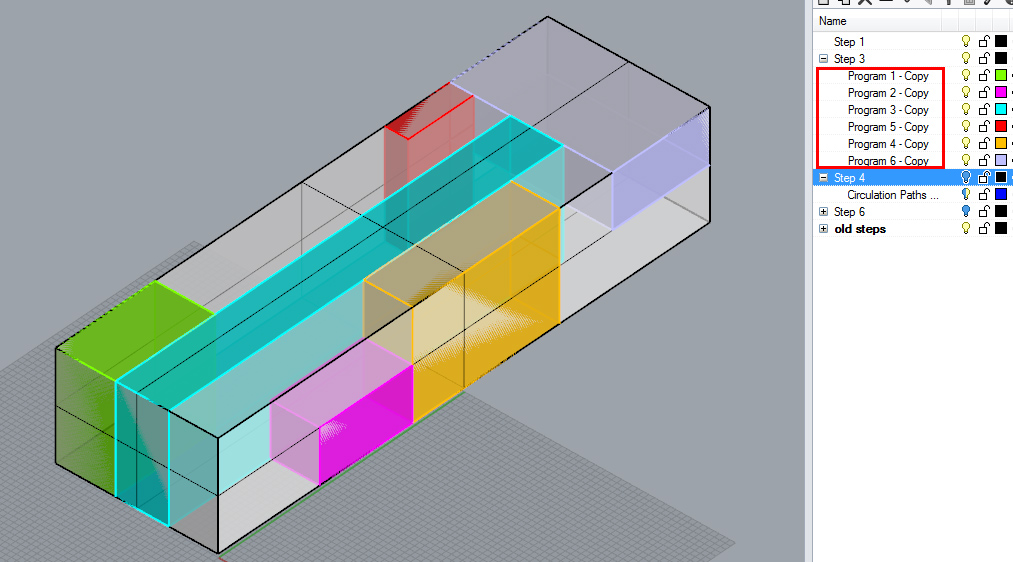
- Self-explanatory. Place the boxes where you think the program should go, working within the massing boundary.
Step 4: Draw Circulation
- Also self-explanatory. How do you get from the outside in, and how do you move from the entrance to each of the programmatic entities?
Step 5: Separate Parts
-
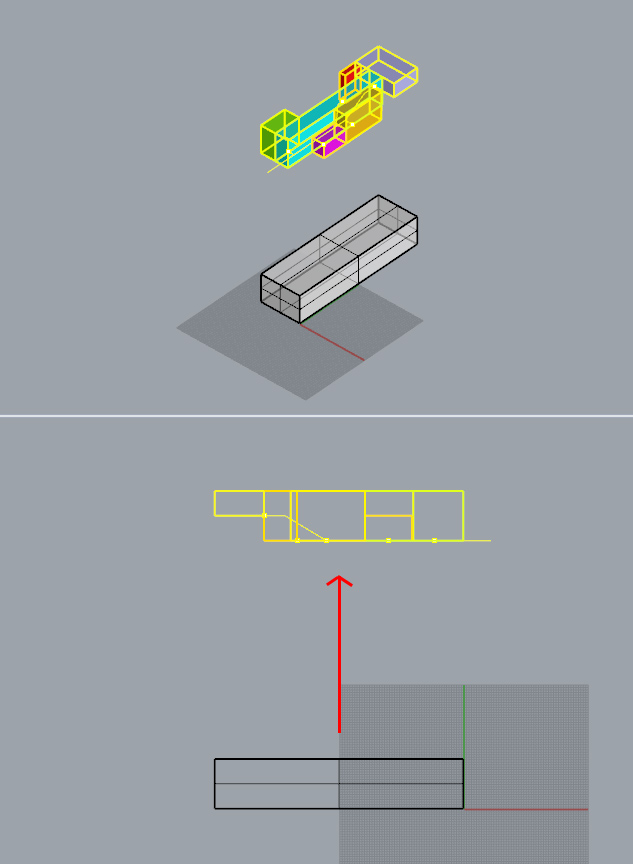
Select the program layers and circulation path and move to front or a side view. While holding shift, move them up. This will pull the program layers and path out of the massing, so they are more distinguishable.
Step 6: Annotations and Construction Lines
Construction Lines
-
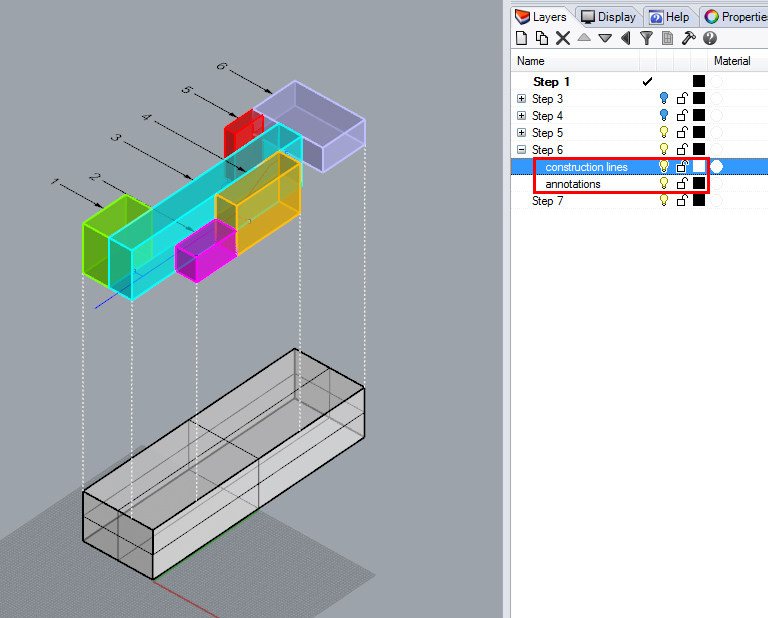
First, draw in the connecting construction lines, stemming from the program spaces to the massing. We're simply trying to clearly show the boxes fit into the massing, nothing more. You don't need to connect each box to the massing. That would probably look messy and confusing.
Annotations via Leaders
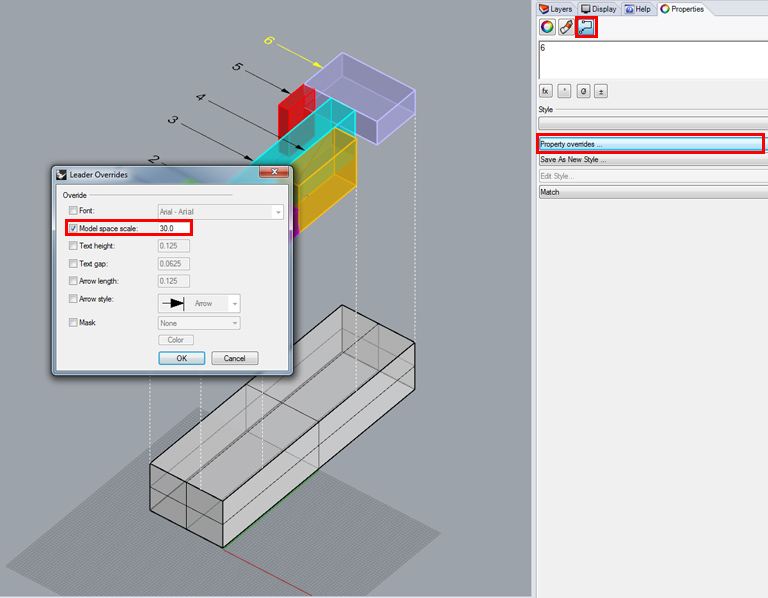
- Next, type "leader" in the command promt and draw a line from your program boxes to another point. Enter the program description in the text box and hit enter. Follow the same axis (such as the y-axis) for clarity. You'll notice that the text and arrow heads are really small by default. To edit their size, select a leader object, go to properties, select "leader properties" and then select "property overides...". From there, you can edit the model space sizing of your leader text and arrowheads to match the scale of your axon, as well as change from an arrow to a point or a dimension line or a few other options.
-
You should now have something like this:
Step 7: Make2D
-
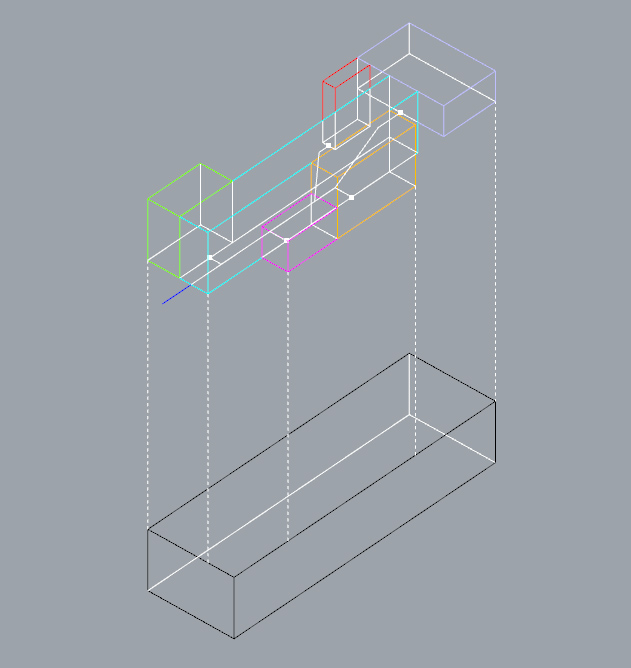
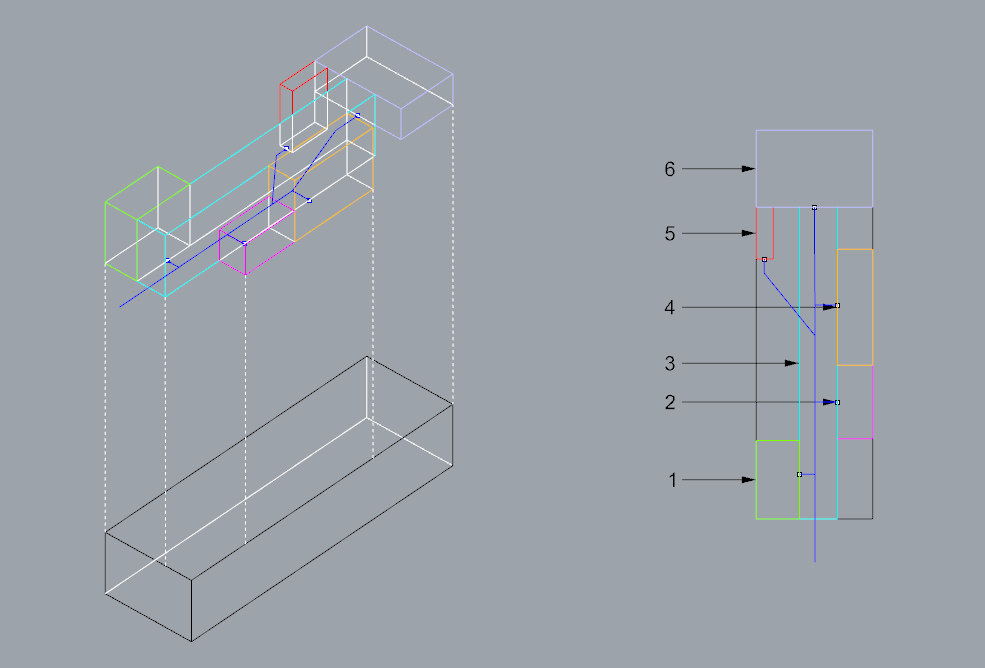
Now, with everything selected, we'll Make2D in the Axon View. Make sure to select "Maintain Source Layers" and "Show Hidden Lines". We'll also throw in a Make 2D from the Top View and pull it to the side. The leaders will only show up in Top View. If you explode them, they can show up in perspective or Axon view, but the scaling will need to be adjusted.
-
The Circulation Paths can be put on one layer rather than divided between hidden and visible, so that they can be called out together later on.
- Select the Make2D lines and Export them to an Adobe Illustrator file for use later on.
Step 8: VRay Render
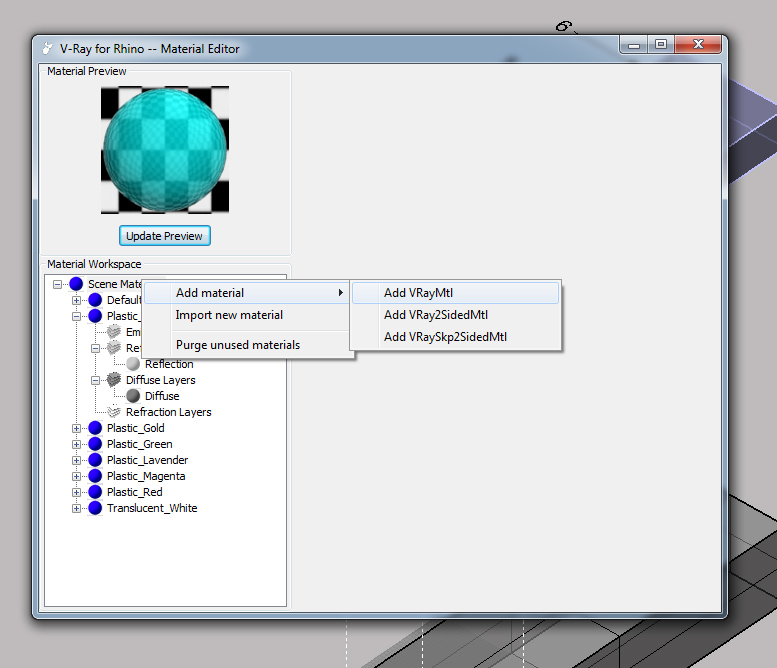
- At this point, we need to create some VRay materials. We'll make every material translucent, so we can see what lies behind. Make a material for the massing and each program box. The massing will be white. Each color needs it's own material. From scratch, right click on Scene Materials and select Add Material>AddVRayMtl.
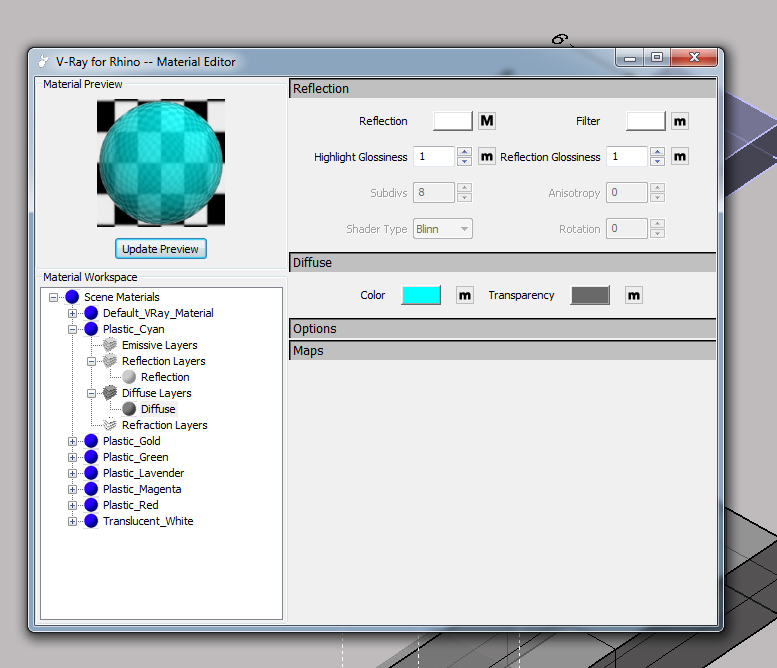
- For each program box and the massing box, simply change the diffuse color to match your layer colors, and adjust the transparency to "dark grey". You can add a reflection layer if you want, but it's not necessary.
-
Then adjust your Environment Options per below. By adjusting the size multiplier of the global illumination (GI) and the shadow subdivisions, you can decrease the contrast of the shadows, creating "soft shadows", which is helpful for the purpose of the diagram. If the diagram was about light, I might want the shadows. Use this setting appropriately. I've also decreased the intensity of the GI to .6 and raised the background to 3. I also added an
infinite plane
for the soft shadows to cast onto.
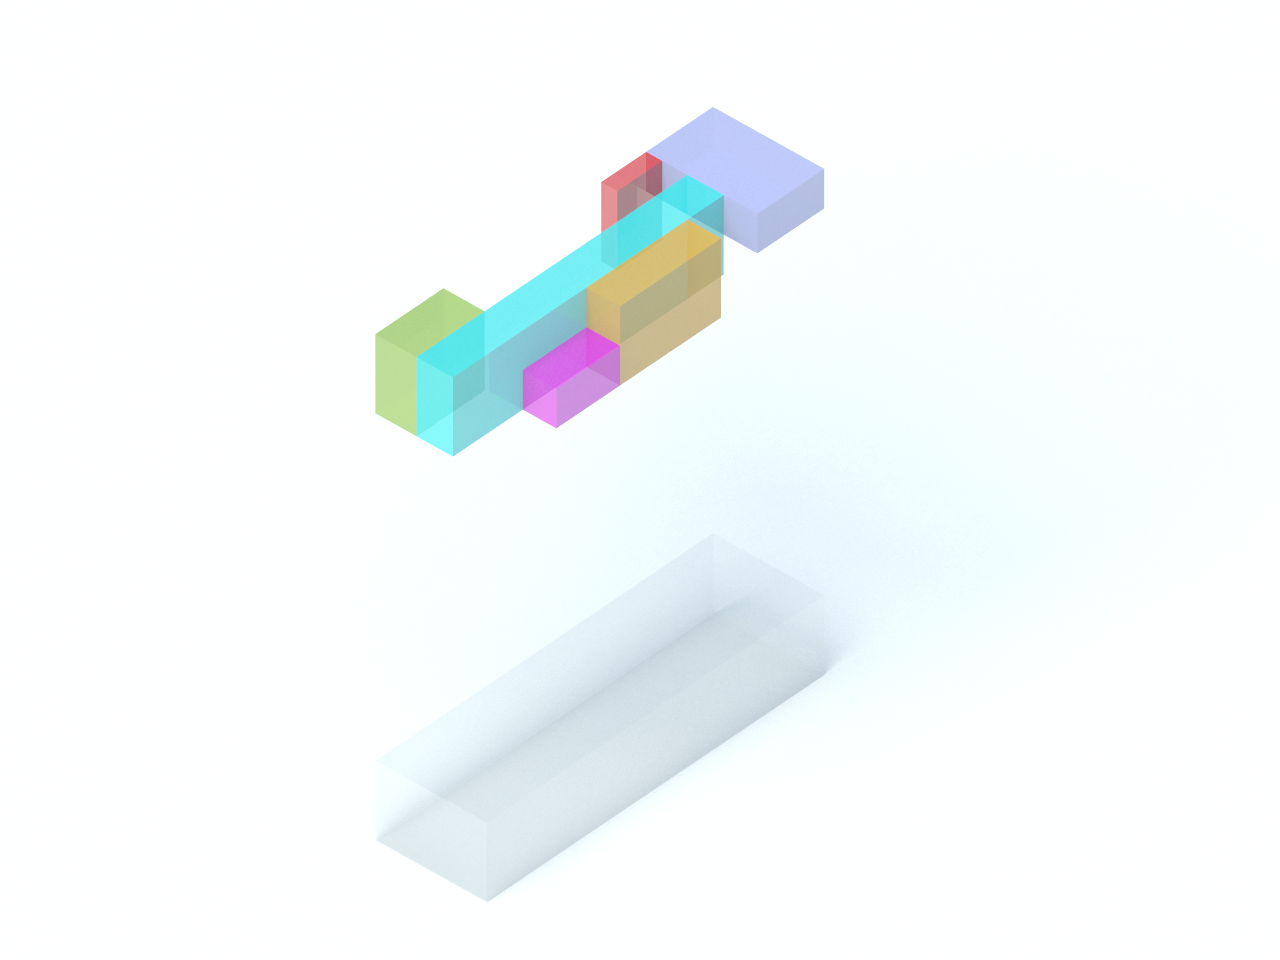
- Your render should come out like this:
Step 9: Assemble Render and Lines
-
Now, Open the Illustrator file you made earlier. Make a new layer and name it "Image". Move the layer to the bottom placement and place the render in the file. Lock this layer. Then scale the vector lines to match the render scale. Do not scale up the render!
-
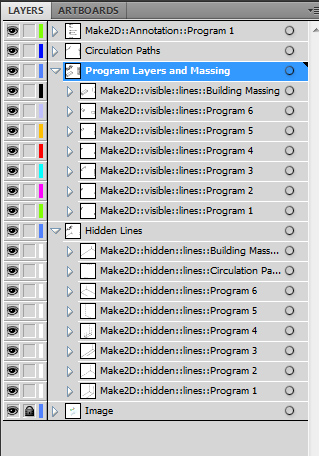
For clarity, try making a new layer called "hidden lines", and moving all of the hidden layers for each box to this new layer. That way, you don't have too many layers confusing you. You could do the same for the program layers.
- If you select all the layers, you can make all of the strokes black. Then select the Program and Massing layer and set the stroke weight to .5. Set the hidden lines to .25, with a dash of 3pt. The circulation paths are being called out and can stay at .75 pt or 1pt. You can set the endpoints to be arrows or dots. Since we didn't render the top view, we can simply add the colors by making some quick objects and manually entering the colors. If you have a complex program layout, you'll probably want to render the top view as well, just to save time. The annotation layer will need to be ungrouped and fine-tuned with some small tweaks, like changed font (if you want), adjusting arrow to dot (if you want).
-
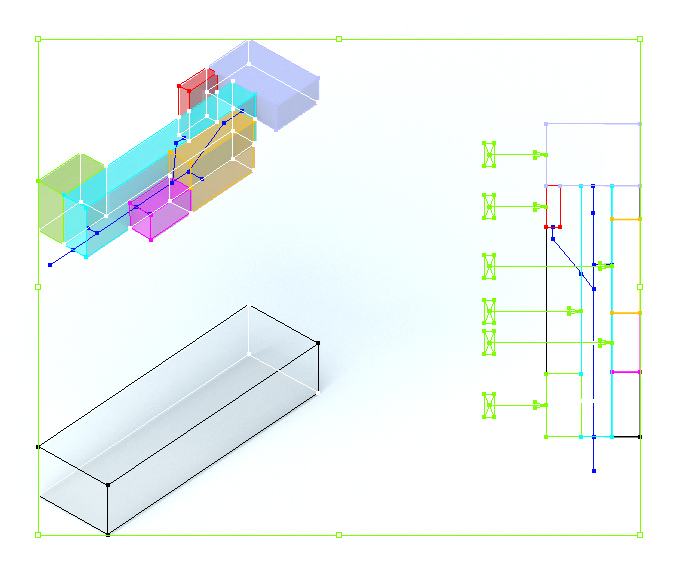
When all is done, your saved file should look something like this:
- You can use this method in a series to show multiple programmatic layouts when designing. It's a simple way to understand occupation, movement and massing.


