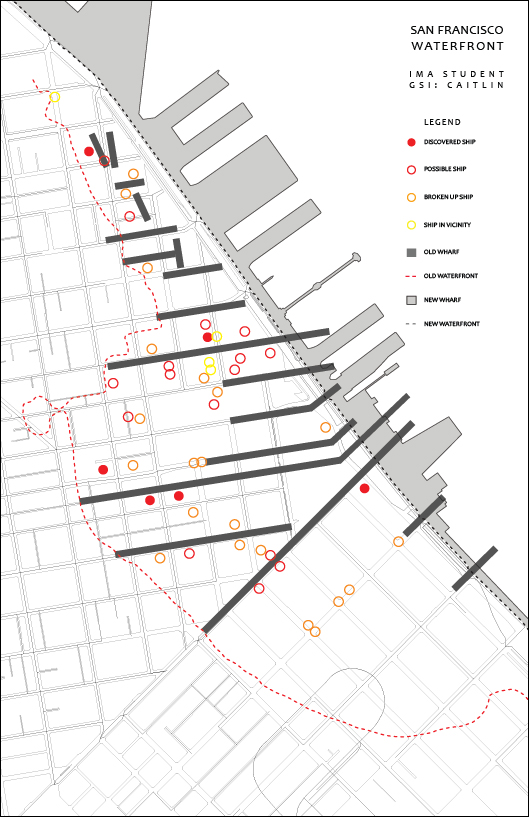
Creating a Site Diagram Using Historical Maps

Screenshot Mapping final.jpg
This exercise practices diagramming and mapping at the urban scale. Information is abstracted from existing historical maps and is layered on top of a base drawing in order to reveal new information about the site and surrounding context.
Assessment objectives
  • Identify and extract specific information from historical maps
  • Trace over maps to achieve a precise abstraction of selected information
  • Reveal new relationships through layering, overlap, and juxtaposition of data
Exercise Type Problem Set
Evaluation Criteria
High Pass
The final map includes all layers of information and is evocative. This includes the new waterfront and piers, the old waterfront and piers, and all of the buried ships. Each layer is precisely drawn and can be read clearly and easily, differentiated by colors and lineweights. The legend is a clear visual explanation of the map and everything is labeled correctly.
Pass
The map includes all layers of information, but has minor flaws related to precision, layer hierarchy, colors, and line weights.
Low Pass
The map includes most layers of information, but they are not clearly legible. There are multiple mistakes in precision, layer hierarchy, line weights, and fills.
Fail
The map is incomplete and illegible. Multiple layers of information are missing.
Uses Tool(s) Tool:Rhino v4.x , Tool:Illustrator CS5
Uses Workflow(s) Workflow:428374

Submission

The final map should be printed on an 11" x 17" sheet of paper (portrait) and submitted to the bins in the 6th + 7th floor elevator lobbies by 5:00 pm today (Friday, October 19).

Resources

This exercise uses this Rhino file as the base drawing. It also uses this Google Earth image and this historical map of buried ships.